How to estimate Lifetime Value; Sample cohort analysis July 19, 2010
Posted by jeremyliew in Ecommerce, ltv, subscription.42 comments
In many businesses, repeat purchase behavior is a key driver of value. Many companies track % of repeat purchases as a key business metric. This is useful in steady state, but can sometimes be quite misleading if the company is showing substantial growth. By definition, growth implies many first time customers, and the mix of these new customers can distort the view into how much repeat purchase behavior is actually occuring.
I prefer to try to analyze repeat pruchase behavior, and hence, estimate lifetime value, by doing cohort analysis. This is approximate by definition, but it can give you some sense of lifetime value well before you actually see a full customer lifetime, which can help in accelerating decisions about marketing and customer acquisition. I recently posted about how you can improve LTV and CAC for your subscription or repeat purchase business. But how do you estimate Lifetime value?
I’ve uploaded a spreadsheet with a sample cohort analysis, using representative but dummy data to illustrate how to do this.
In this particular example, I look at a hypothetical subscription business. Assume that the business has been in operation for one year. First, divide the users into cohorts depending on when they initially subscribed to the service. I calculate retention at the end of month N by dividing the number of subscribers still subscribing after month N by the total number of subscribers that started in each cohort. These are the numbers in blue. Obviously, for the subscribers that started in month 1, we have 12 months of retention data, for the subscribers that started in month 2 we have 11 months of retention data, and so on.
By averaging across the cohorts, you can get an average retention rate at the end of one month, two months and so on. As the cohorts age, there are fewer datapoints to average over, and hence the potential for error is greater. However, it is still a useful exercise to get an early indication of how the business looks.
A typical pattern found in subscription businesses is that after a steep drop off after an initial period, month-on-month attrition rates tend to level off. You can see a similar pattern in this example, where after the first month, month-on-month attrition rates are around -6% (ie month N subs ~ 94% of month [N-1] subs).
If you see a pattern like this, you can extrapolate forward using the same month-on-month attrition across several years. As you can see in the model, we extrapolate an average lifetime of 9.77 months by extrapolating forward over 5 years of data.
So if you were a subscription business charging $20/month with 90% gross margins (after accounting for customer service costs for example), then you would attribute a lifetime value for a new customer of 9.77 x $20 x 90% = $176. This sets an upper bound of what you would be willing to pay to acquire a customer (although in practice, you would prefer to see a ratio of CAC/LTV in the 25-35% range).
This example is for a subscription business where the key value driver is the number of active subscribers. However, you can conduct similar analysis on any type of repeat behavior business. In a social business the metric might be activity (e.g. how many users posted a photo this month), and in a social game the metric might be dollars spent in virtual goods that period. The measurement periods may vary according to the tempo of the business. Many social games do their cohort analysis on a daily or weekly basis, whereas some ecommerce companies whose purchases are less frequent may do their cohort analysis on a quarterly basis. This will dictate how long you have to collect data before you have enough data to project forward.
Different billing mechanisms can complicate this (e.g. an annual billing system will by nature skew average lifetime upwards) and while these can be important levers, it is usually helpful to hold billing constant and compare cohorts on a same-billing basis, at least initially. However, this cohort analysis is also useful tool to see what the impact of changes in billing, registration flow, product features etc can have on retention as you can often see an increase in early month retention from later cohorts.
The spreadsheet for the sample cohort analysis is read only but you can download it to play with it yourself.
I’d love to hear from others how they estimate lifetime value.
UPDATE: June 2012 – I have a new post describing how to estimate lifetime value for an ecommerce business using cohort analysis.
Why online brand spending will create new winners in online ad networks July 14, 2010
Posted by jeremyliew in advertising, branding.35 comments
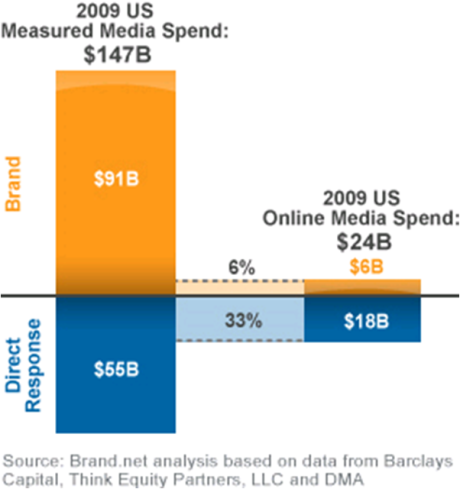
One of Lightspeed’s consumer internet predictions for 2010 is that brand advertising dollars are going to start to flow online at scale. Two thirds of all ad spending in the US is for brand advertising, yet three quarters of online ad spending is direct response.
The recession of the last couple of years has provided a catalyst to drive more brand marketers online in an effort to seek greater efficiency in their media buys, and as they have tasted some success, they will continue to spend online as their marketing budgets recover.
Late last year the IAB put out a very interesting study about building brands online. I recommend that you read the whole thing if you are involved in the online advertising industry.
For those of you who won’t, here are some highlight charts:
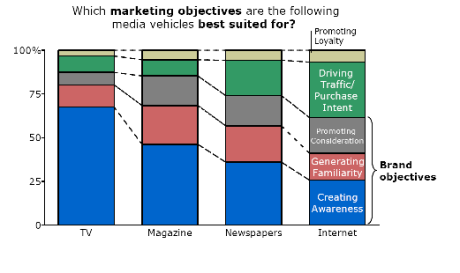
Marketers believe that the internet can be a branding mechanism:
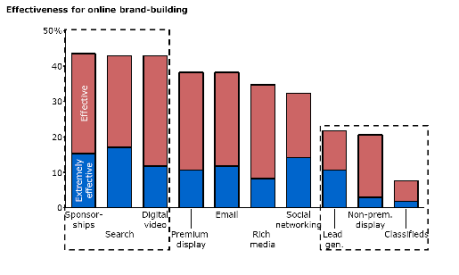
But the bulk of online advertising volume today is not considered effective for brand building:
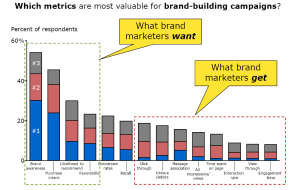
This is because most online ad inventory has been optimized for direct response advertisers, whereas brand marketers want to see their traditional metrics (click image to see full detail):
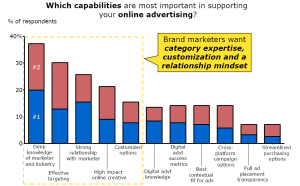
Furthermore, brand advertisers want relationships with the media companies that they work with, not simply self service efficiency (again, click image to see full detail)
Most brand advertisers have primarily stuck with portals and big publishers who offer brand safety, reach/frequency control, reporting on the metrics that they care about and strong relationship, but often tied to higher priced media. As brand advertisers seek better efficiency from their online media budgets, they will turn increasingly to ad networks. Although there are over 300 ad networks today, the vast majority of them have grown over the last 10-15 years by optimizing their offering for the direct response advertisers who have constituted the vast majority of online advertisers to date. I think we’ll see a new generation of ad networks emerge who are tuned to cater to the specific needs of brand advertisers, and I’m actively looking to invest in companies with this mindset.
